+44(0)28 9032 2228
Popular Courses
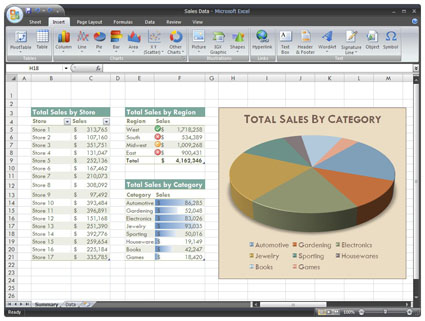
 Excel - Intro 2010/2013/365
 SQL Query Language Intro
 Power BI - Level 1 (1 - Day)
.jpg) Power Query
Power Query

-
 3/3/2025
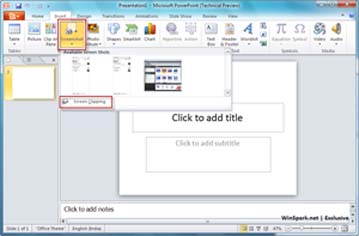
Intro to Microsoft PowerPoint Training from Belfast Northern Ireland - Online Training Course -
 14/4/2025
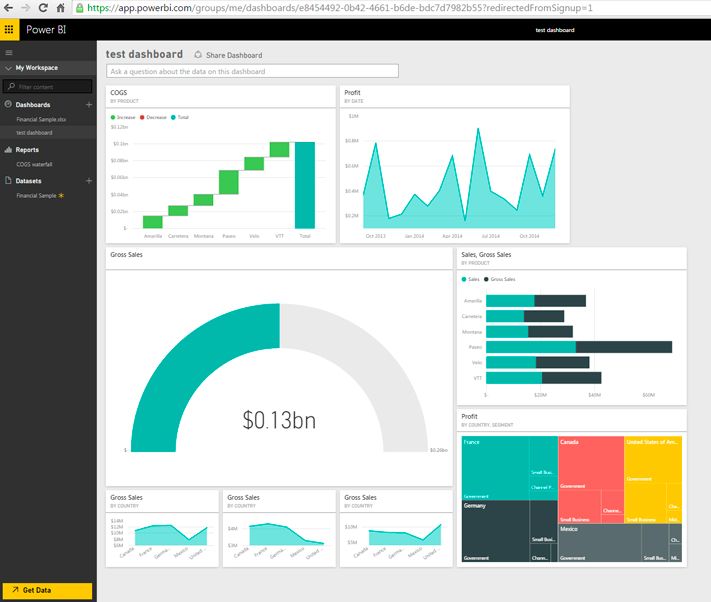
CLASSROOM & ONLINE Power BI Level 1 course -
 14/4/2025
New Course - Microsoft Power BI Introduction training from Belfast Northern Ireland - Classroom & Online Training -
 3/3/2025
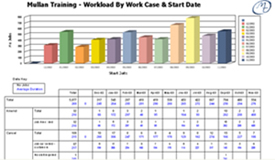
Data Visualisation & Presentation Techniques with Mullan IT Training -
 3/3/2025
CITB - The Construction Industry Training Board have included Mullan Training on their Approved List We deliver Trainings in Belfast Northern Ireland OR On Customer's Own Premises -
 17/4/2025
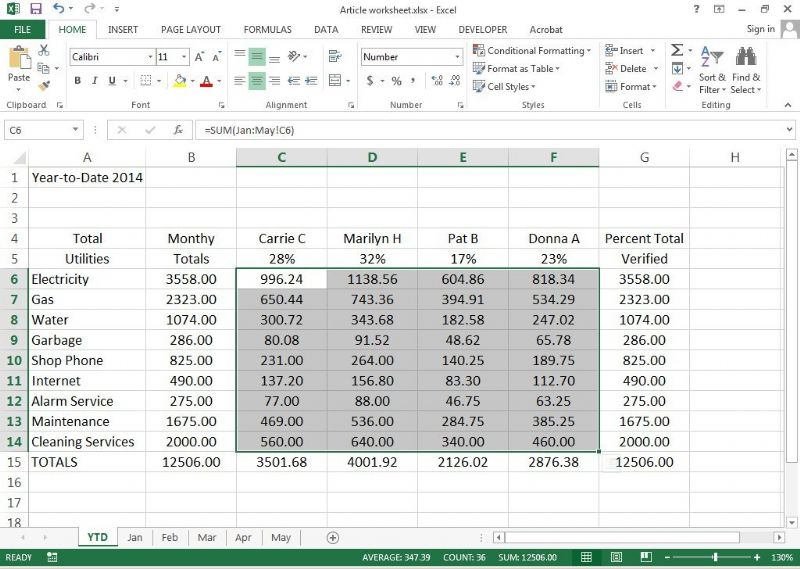
HOT COURSE - Introduction to Microsoft Excel Training in Belfast Northern Ireland OR On your Own Premises - Call NOW to Book -
 6/5/2025
Intro to Crystal Reports Training from Belfast Northern Ireland - Virtual, Online - Learn how to create powerful and dynamic reports, presenting your data in an attractive format -
 30/4/2025
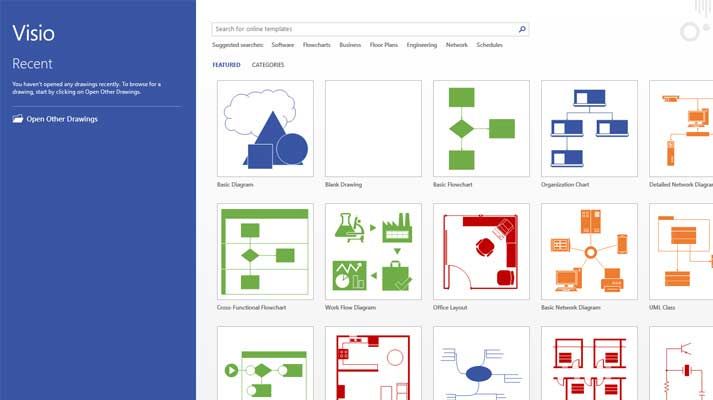
Microsoft Visio Training from Belfast Northern Ireland - Maximise the potential of the Visio application -
 25/3/2025
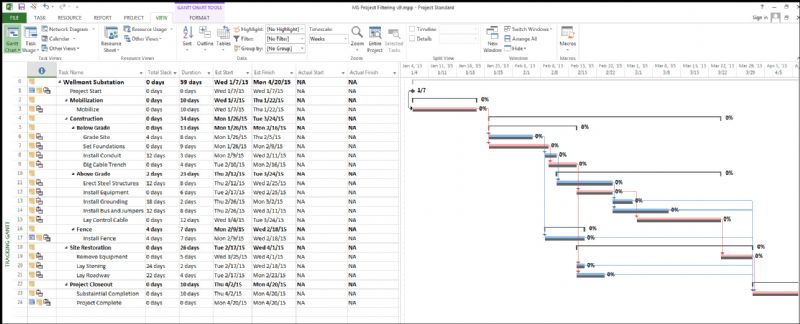
Introduction to Microsoft Project Training from Belfast Northern Ireland - Classroom Based Training & Via Our Online Classrooms -
 3/3/2025
Microsoft 365 Training Courses now available inc Belfast, Omagh, Derry, Newry and Throughout Northern Ireland -
 3/3/2025
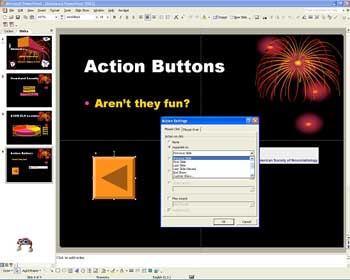
Need to Produce and Deliver Professional Presentations? Book NOW on our Advanced Microsoft PowerPoint course Training in Belfast Northern Ireland OR On your Own Premises - Limited places available -
 3/3/2025
Hot Course - 2 Day Advanced Microsoft Excel Course Training - CALL NOW TO BOOK -
 26/3/2025
Microsoft Sharepoint Introduction Training Course in Belfast NI -
 3/3/2025
IT/Computer Room Hire in Belfast City Centre (Opposite Europa Hotel) - Call now to book -
 20/3/2025
1 day Adv Microsoft Excel CourseTraining in Belfast Northern Ireland OR On your Own Premises - Places Available - Call Now to Book -
 3/3/2025
Power BI Paginated Report Builder -
3/3/2025
HOT COURSE - Intro to Microsoft Visio Training in Belfast Northern Ireland OR Virtually - CALL NOW to secure a place on this course -
 31/3/2025
Microsoft 365 training courses in Word, Excel, Access, Outlook, Powerpoint, Sharepoint in Belfast and Omagh Northern Ireland

Please click here to return to the homepage.
-
14/4/2025
CLASSROOM & ONLINE Power BI Level 1 course -
3/3/2025
Need to Produce and Deliver Professional Presentations? Book NOW on our Advanced Microsoft PowerPoint course Training in Belfast Northern Ireland OR On your Own Premises - Limited places available -
30/4/2025
Microsoft Visio Training from Belfast Northern Ireland - Maximise the potential of the Visio application -
3/3/2025
IT/Computer Room Hire in Belfast City Centre (Opposite Europa Hotel) - Call now to book -
26/3/2025
Microsoft Sharepoint Introduction Training Course in Belfast NI -
6/5/2025
Intro to Crystal Reports Training from Belfast Northern Ireland - Virtual, Online - Learn how to create powerful and dynamic reports, presenting your data in an attractive format -
14/4/2025
New Course - Microsoft Power BI Introduction training from Belfast Northern Ireland - Classroom & Online Training -
3/3/2025
Power BI Paginated Report Builder -
25/3/2025
Introduction to Microsoft Project Training from Belfast Northern Ireland - Classroom Based Training & Via Our Online Classrooms -
3/3/2025
Microsoft 365 Training Courses now available inc Belfast, Omagh, Derry, Newry and Throughout Northern Ireland -
20/3/2025
1 day Adv Microsoft Excel CourseTraining in Belfast Northern Ireland OR On your Own Premises - Places Available - Call Now to Book -
31/3/2025
Microsoft 365 training courses in Word, Excel, Access, Outlook, Powerpoint, Sharepoint in Belfast and Omagh Northern Ireland -
3/3/2025
Data Visualisation & Presentation Techniques with Mullan IT Training -
3/3/2025
HOT COURSE - Intro to Microsoft Visio Training in Belfast Northern Ireland OR Virtually - CALL NOW to secure a place on this course -
17/4/2025
HOT COURSE - Introduction to Microsoft Excel Training in Belfast Northern Ireland OR On your Own Premises - Call NOW to Book -
3/3/2025
CITB - The Construction Industry Training Board have included Mullan Training on their Approved List We deliver Trainings in Belfast Northern Ireland OR On Customer's Own Premises -
3/3/2025
Hot Course - 2 Day Advanced Microsoft Excel Course Training - CALL NOW TO BOOK -
3/3/2025
Intro to Microsoft PowerPoint Training from Belfast Northern Ireland - Online Training Course