+44(0)28 9032 2228


-
 13/5/2024
IT/Computer Room Hire in Belfast City Centre (Opposite Europa Hotel) - Call now to book -
 18/4/2024
Intro to Crystal Reports Training from Belfast Northern Ireland - Virtual, Online - Learn how to create powerful and dynamic reports, presenting your data in an attractive format -
 7/5/2024
Hot Course - 2 Day Advanced Microsoft Excel Course Training - CALL NOW TO BOOK -
 11/3/2024
HOT COURSE - Introduction to Microsoft Excel Training in Belfast Northern Ireland OR On your Own Premises - Call NOW to Book -
 9/5/2024
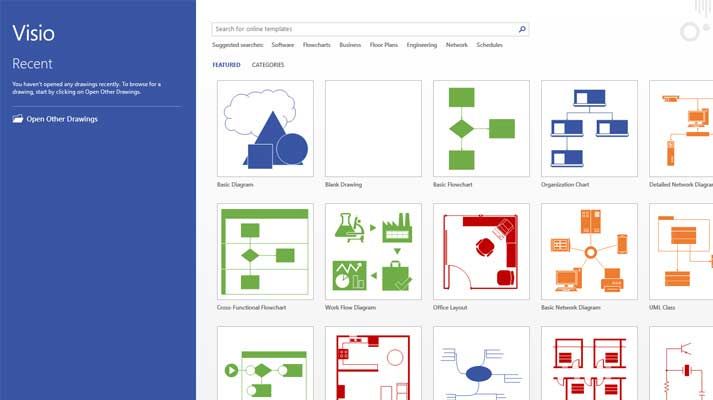
HOT COURSE - Intro to Microsoft Visio Training in Belfast Northern Ireland OR Virtually - CALL NOW to secure a place on this course -
 11/6/2024
CITB - The Construction Industry Training Board have included Mullan Training on their Approved List We deliver Trainings in Belfast Northern Ireland OR On Customer's Own Premises -
 17/6/2024
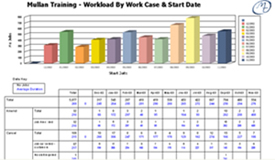
Data Visualisation & Presentation Techniques with Mullan IT Training -
25/4/2024
Microsoft Visio Training from Belfast Northern Ireland - Maximise the potential of the Visio application -
 23/4/2024
Microsoft 365 Training Courses now available inc Belfast, Omagh, Derry, Newry and Throughout Northern Ireland -
 10/6/2024
Power BI Paginated Report Builder -
 25/3/2024
Microsoft 365 training courses in Word, Excel, Access, Outlook, Powerpoint, Sharepoint in Belfast and Omagh Northern Ireland -
 14/3/2024
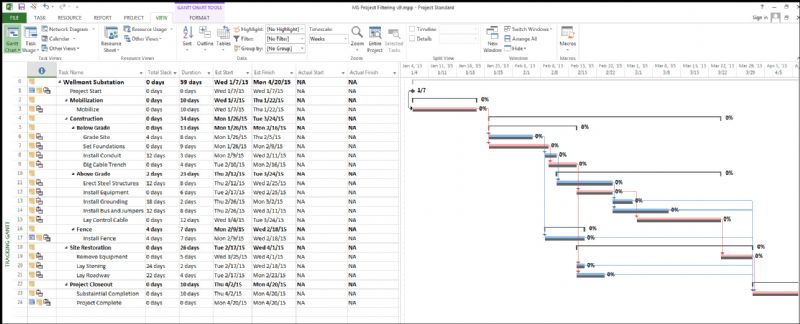
Introduction to Microsoft Project Training from Belfast Northern Ireland - Classroom Based Training & Via Our Online Classrooms -
 5/3/2024
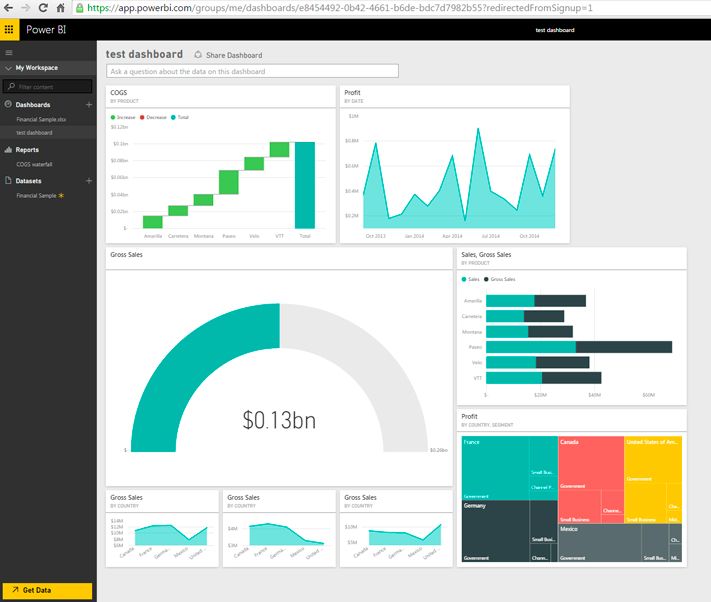
New Course - Microsoft Power BI Introduction training from Belfast Northern Ireland - Classroom & Online Training -
 5/3/2024
CLASSROOM & ONLINE Power BI Level 1 course -
 8/5/2024
Intro to Microsoft PowerPoint Training from Belfast Northern Ireland - Online Training Course -
 10/4/2024
Microsoft Sharepoint Introduction Training Course in Belfast NI -
 20/6/2024
Need to Produce and Deliver Professional Presentations? Book NOW on our Advanced Microsoft PowerPoint course Training in Belfast Northern Ireland OR On your Own Premises - Limited places available -
 22/4/2024
1 day Adv Microsoft Excel CourseTraining in Belfast Northern Ireland OR On your Own Premises - Places Available - Call Now to Book
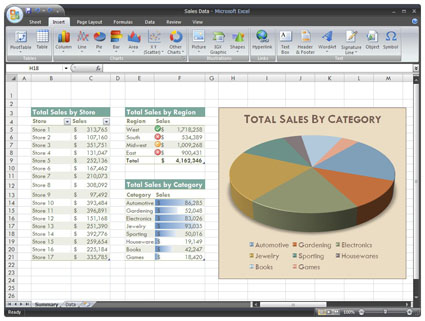
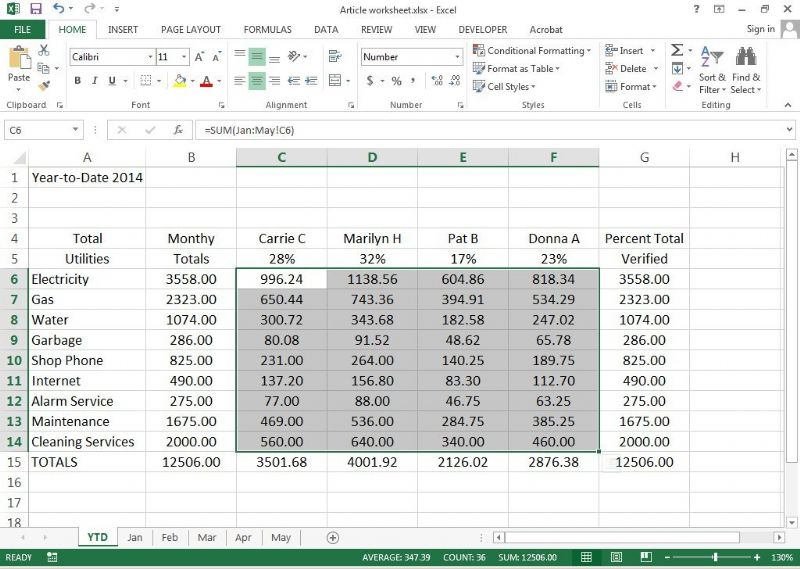
Financial Modelling with Excel 2010/2013/365
Enquire About This CoursePREREQUISITES
This course is not suitable for inexperienced Excel users. Delegates will be expected to be familiar with the following in Excel:
- Linking Spreadsheets
- IF Function & Nested IF Statements
- And & Or Functions
- Lookup Functions (Horizontal And Vertical Lookup)
- Subtotals
- Conditional Formatting
SUMMARY
In this course you will build a comprehensive and accurate Finance Model that can be used as a decision making tool.
- Learn how to adjust model variables and source data sets using dashboard interfaces (radio buttons, drop down lists, command buttons etc.)
- Learn how to effectively use Pivot Tables to enhance the functionality of your spreadsheet model
- Learn how to apply scenario techniques to determine alternatives and constraints in your Financial Model
- Discover how Excel can help you decide whether to undertake an investment project
- Learn how and when to use Excel's NPV, IRR & MIRR functions to assess your capitol
LEARNING OUTCOMES
- Having completed the training the attendees will be able to:
- Communicate business and data insights with dashboards
- Understand how to use Excel's NPV, IRR & MIRR Functions
- Build a Cash Flow statement
- Build a Valuation model from scratch

COURSE CONTENT
1. Spreadsheet: design and structure
Mastering key steps with practical exercises to practically design and structure your spreadsheet layout in order to achieve a well-constructed and error-free financial model.
Use tried and tested spreadsheet techniques for tracking company cash flow and monitoring profitability.
Master the key steps in successfully building a comprehensive and accurate finance model as a decision-making tool for understanding:
- What are financial modeling and its objectives?
- The power of spreadsheets:
- Coordinate various revenue and expenditure budgets
- How to avoid the pitfalls of a poorly designed spreadsheet:
- Key variables and rules
- End result of the model
- Formatting of the spreadsheet
- The layout in designing an error-free financial model
- Data validation
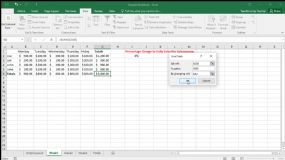
2. Effectively using pivot tables to enhance the functionality of your spreadsheet model
- Use Pivot Tables to perform a cross-tabulation of data, summarizing them into one or more classifications.
- By creating pivot charts, which combine all the same functionality of standard excel charts with the dynamic characteristics of pivot tables, you will be able to achieve a graphic report that updates data whenever it is changed.
Learn how to:
- Understand the key features of a Pivot Table
- Prepare a Pivot Table
3. Applying scenario techniques to determine alternatives and constraints in your financial model
- By creating multiple scenarios for a single what-if model, you will be able to assess each scenario with its own set of variables. Understand relationships between scenarios, using scenario summary and pivot table reports by:
- Defining scenarios in your spreadsheet
- Understanding how to browse your scenarios
- Adding, editing and deleting scenarios
4. Determining the appropriate capital budgeting models to formulate effective capital investment decisions
Practical Exercises
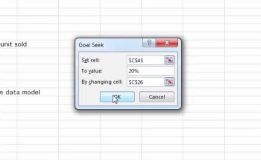
Discover how Excel can help you decide whether to undertake an investment project and correctly rank your projects. Learn how and when to use Excel?€™s NPV, IRR and MIRR functions to assess your capital expenditure project by:
- Understanding the NPV rule for judging investments and projects
- Assessing the IRR rule for judging investments
- Determining the appropriate method to use NPV or IRR
- Evaluating when IRR and NPV give the same answer
- Establishing when to apply IRR and NPV for different project rankings
- Using modified IRR (MIRR) to overcome the weaknesses of IRR
.jpg)
Click here to download our Course Outline:
MS Financial Modeling With Excel 1 Day _11_
This course is for Advanced Excel users. Please complete our Excel Competency Checklist, return to us and we will advise if you are eligible to attend this course.
Enquire About This Course
-
10/6/2024
Power BI Paginated Report Builder -
8/5/2024
Intro to Microsoft PowerPoint Training from Belfast Northern Ireland - Online Training Course -
11/6/2024
CITB - The Construction Industry Training Board have included Mullan Training on their Approved List We deliver Trainings in Belfast Northern Ireland OR On Customer's Own Premises -
20/6/2024
Need to Produce and Deliver Professional Presentations? Book NOW on our Advanced Microsoft PowerPoint course Training in Belfast Northern Ireland OR On your Own Premises - Limited places available -
25/4/2024
Microsoft Visio Training from Belfast Northern Ireland - Maximise the potential of the Visio application -
17/6/2024
Data Visualisation & Presentation Techniques with Mullan IT Training -
22/4/2024
1 day Adv Microsoft Excel CourseTraining in Belfast Northern Ireland OR On your Own Premises - Places Available - Call Now to Book -
9/5/2024
HOT COURSE - Intro to Microsoft Visio Training in Belfast Northern Ireland OR Virtually - CALL NOW to secure a place on this course -
18/4/2024
Intro to Crystal Reports Training from Belfast Northern Ireland - Virtual, Online - Learn how to create powerful and dynamic reports, presenting your data in an attractive format -
14/3/2024
Introduction to Microsoft Project Training from Belfast Northern Ireland - Classroom Based Training & Via Our Online Classrooms -
7/5/2024
Hot Course - 2 Day Advanced Microsoft Excel Course Training - CALL NOW TO BOOK -
5/3/2024
CLASSROOM & ONLINE Power BI Level 1 course -
11/3/2024
HOT COURSE - Introduction to Microsoft Excel Training in Belfast Northern Ireland OR On your Own Premises - Call NOW to Book -
10/4/2024
Microsoft Sharepoint Introduction Training Course in Belfast NI -
23/4/2024
Microsoft 365 Training Courses now available inc Belfast, Omagh, Derry, Newry and Throughout Northern Ireland -
25/3/2024
Microsoft 365 training courses in Word, Excel, Access, Outlook, Powerpoint, Sharepoint in Belfast and Omagh Northern Ireland -
5/3/2024
New Course - Microsoft Power BI Introduction training from Belfast Northern Ireland - Classroom & Online Training -
13/5/2024
IT/Computer Room Hire in Belfast City Centre (Opposite Europa Hotel) - Call now to book